


To gain a better understanding of the statistics used, visit the glossary by Noah Libby-Haines. Interested in making your own statistical comparisons?
Note: The numbers for Gasper Vidmar and Oguz Savas come from the Euroleague, not the Turkish League.
Points Per-40 Minutes Pace Adjusted
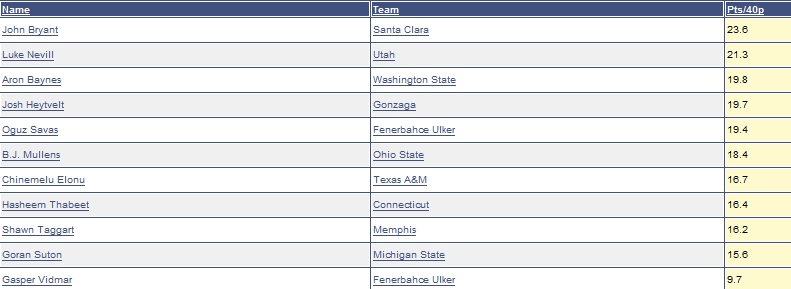
This stat is meant to gauge how quickly each center puts point in the board. A recurring theme in the early part of this analysis, neither of the top prospects Hasheem Thabeet, nor B.J. Mullens scored at a high rate for their respective schools. Some of that has to do with their small role on the team, but it also tells us a bit about how prepared they are to contribute on the block. Mullens edges Thabeet here, as does Chinemelu Elonu, but this might have something to do with how many minutes Thabeet played as it is of where they actually rank. All three players are raw, but it would be interesting to see how they would perform playing for teams similar to those that the players at the top of our list played for.
As we can see, the top two players in this group came from non-power conferences, and the fourth, Josh Heytvelt, comes from a team who played most of its tough games out of conference. John Bryant earns the top spot, and reminds us how players with size and good hands can be effective against lower levels of competition. He lost a substantial amount of weight since he showed up on our radar, but still lacks the athleticism of an NBA center. Luke Nevills scoring rate is comparable, and the lefty shares some of the assets that made Bryant effective, particularly the brute strength to bully weaker NCAA players around. Aron Baynes is the first big school player on our list, but his scoring rate wouldnt impress in other seasons. Oguz Savas looks very good in this group when you consider he put up those numbers in the best league outside of the NBA.
Free Throw Attempts Per-40 Minutes Pace Adjusted
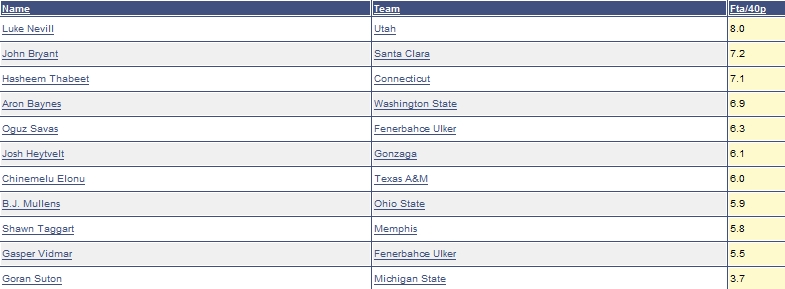
This stat should give us a feel for which players are able to draw contact by using their size and physical tools aggressively down low. Based on how many points these players score per-40 minutes, it is logical that we find our top two scorers at the top of this list as well. Hasheem Thabeet rises up the rankings significantly, which indicates that he didnt shoot a great percentage from the line or take many field goal attempts on the whole given his per-40 scoring rate. B.J. Mullens and Chinemelu Elonu look similar on paper here, and their passivity in some situations hurts their ability to get to the line in bulk. Goran Suton gets to the line quite a bit less than the rest of our group, which has a lot to do with the number of midrange jumpers he attempts versus short range shots around the rim.
Free Throw Attempts Per Field Goal Attempt
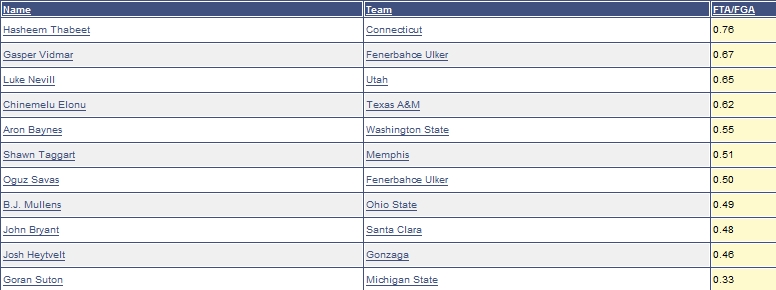
A better indicator of how often this group gets to the line due to the disparity that exists in used positions across the board, this stat ranks Hasheem Thabeet as the most efficient player at getting to the line relative to his usage rate. His size and athleticism makes him tough not to foul in situations around the rim. Gasper Vidmar, while young and a bit raw, utilized similar advantages in the Euroleague. B.J. Mullens and Chinemelu Elonu separate here, due in large part to how many extra possessions Mullens used over the course of the season. John Bryant falls in a similar boat, as he carried Santa Clara in many games. The high-post oriented centers didnt get to the line at a high rate, which makes a lot of sense since they werent in position to get fouled.
Three Point Attempts Per-40 Minutes Pace Adjusted
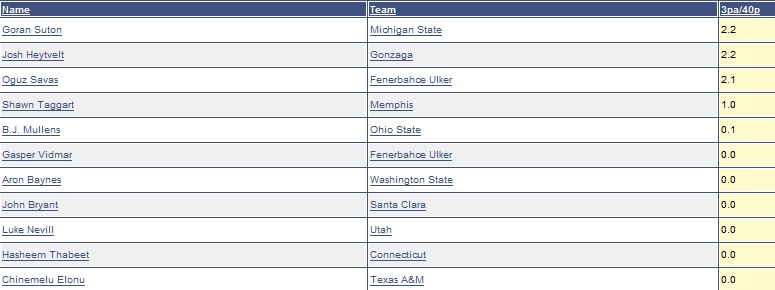
This table tells us which players are, at the very least, not afraid of stepping out to the perimeter to shoot the ball. Goran Suton and Josh Heytvelt head our list, and both are interesting catch and shoot options on the pick and pop or sitting in the high post. Oguz Savas is the most natural power forward in this group, possessing a very high skill level for a big guy and having really developed his range in recent seasons. Shawn Taggart spent some time moving around the perimeter in John Caliparis dribble drive offense, which accounts for a couple attempts. The majority of the players on our list didnt take many jumpers at all this season, regardless of the range. Jump shooting clearly isnt a big piece of the puzzle for the average NBA center prospect, especially for players with good athleticism and a low skill-level like Hasheem Thabeet and B.J. Mullens.
True Shooting Percentage
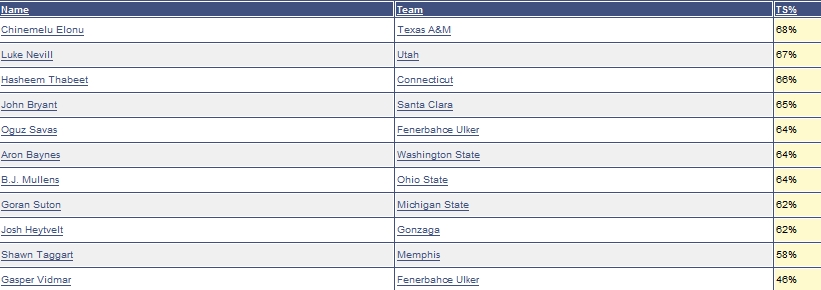
Chinemelu Elonu posts the top mark in true shooting percentage, which tells us which player shot most efficiently by factoring in the value of three-pointers and free throws. Elonu was merely a roleplayer for Texas A&M, but his size, length, and athleticism made him a very solid finisher. Most of the players on that list can make that claim, but Elonu also showed some raw tools with his back to the basket that made him efficient in limited possessions. Luke Nevill and Hasheem Thabeet fall just behind Elonu, and all of the interior-oriented centers fall within 4% of one another. This characterized this group well, those that are more efficient around the basket are often less efficient from the line and vice-versa. The top foul shooters dont show quite as well here since they take more jumpers, but only a few threes. Gasper Vidmar shows his inexperience here, as he falls way behind his peers.
Assists Per-40 Minutes Pace Adjusted
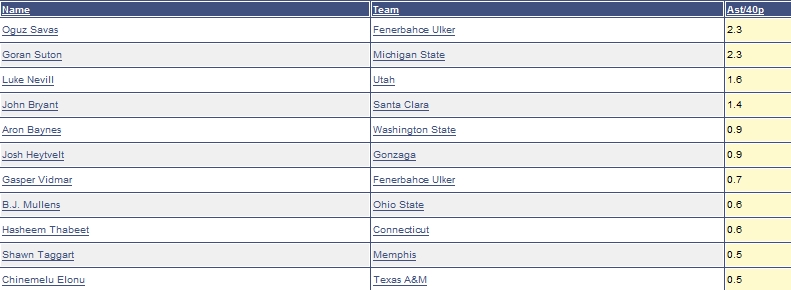
This stat should clue is in to the skill level and versatility of these centers. Oguz Savas lands in first, which isnt even a remote shock. If he wasnt carrying around excess weight and had more natural athletic gifts, he would be a very intriguing prospect. He sees the floor well and does a nice job hitting the open cutter. Considering he functions mostly as a finisher and shooter, his passing is a nice added tough. Goran Suton is a similarly intelligent player, doing a nice job of moving the ball in Tom Izzos offense. Luke Nevill and John Bryant both made decent decisions with the ball when they drew double teams against the weaker opponents in their conferences, while the rest of our group did little, if any playmaking. Chinemelu Elonu is the least productive passer on this list, despite being a complementary player and playing few minutes, he ties Shawn Taggart for last. Hasheem Thabeets passing skills are also nothing to write home about.
Turnovers Per-40 Minutes Pace Adjusted
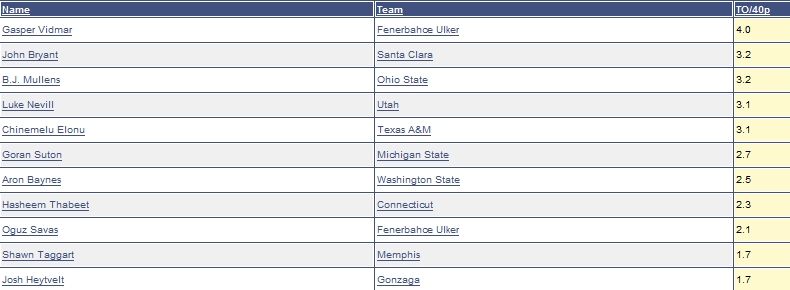
A measure of a players ability to hang onto the ball down low and make good decisions as a passer, this stat seems to follow with what weve seen at other positions. Young, inexperienced, and raw players like Gasper Vidmar and B.J. Mullens are going to turn the ball over at a high rate, as well as high usage players like John Bryant and Luke Nevill. Oguz Savas and Josh Heytvelt look good here, doing a nice job moving the ball out on the perimeter.
Assist to Turnover Ratio
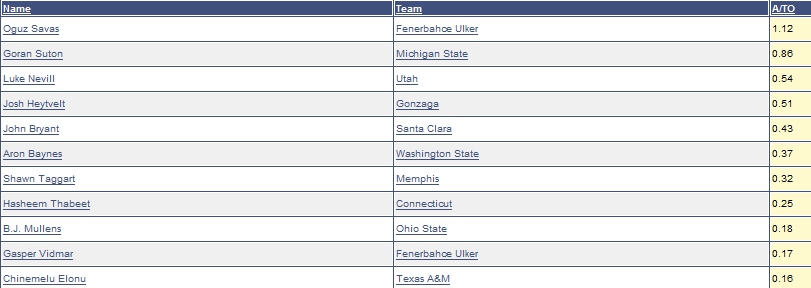
For centers, this statistic is as much a gauge of how well they pass as it is of any playmaking efficiency. Oguz Savas lands at the top of our table, as the only player to tally more assists than turnovers. For the most part, each of our players tallies an assist for every two assists at best, while Chinemelu Elonu tallies more than five turnovers for every one assist. We can see the disparity between the role an inside-outside threat like Savas plays and the one the a catch and finish role player like Elonu. Some teams put more emphasis on their center in their offensive sets than others, which is especially true in the Euroleague, but also prevalent on the NCAA level.
Pure Point Rating
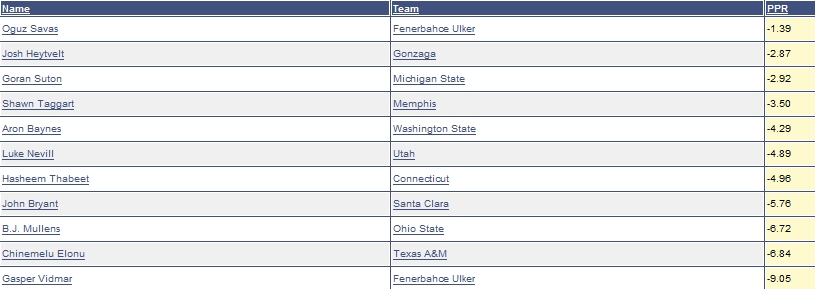
Pure point ratio takes into account the negative value of turnovers and their greater statistic significance in comparison to assists. Savas again finishes on top, but none of the players on this list as very gifted passers. Savass teammate, Gasper Vidmar brings up the rear, as he was overwhelmed at times in the Euroleague. Neither Hasheem Thabeet nor B.J. Mullens offer much as passers out of the post, but then again, neither requires a double team either, which certainly limited their ability to tally assists.
Offensive Rebounds Per-40 Minutes Pace Adjusted
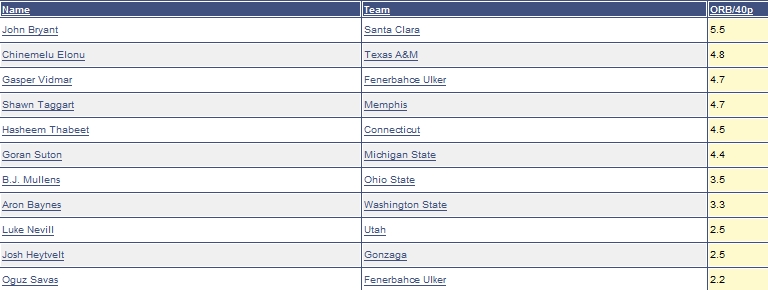
One of the most statistically significant and intuitively valuable plays in basketball, offensive rebounds can often determine the outcome in a game. Having a center that can tip the ball back out to the perimeter, or establish position and secure the ball themselves can be invaluable, especially in roleplayers. If there is one things a bench center should be able to provide, its second-chance opportunities.
John Bryant takes the cake here, using his huge frame to get inside and clear up after his teammates, however Chinemelu Elonu and Gasper Vidmar dont trail him by much. Both players possess outstanding physical tools, and arent held back by their lack of polish as much as they are in other parts of the game. Hasheem Thabeet is in the same boat. B.J. Mullens isnt quite as effective as the other prospects that share his physical tools, which speaks to his need to improve his aggressiveness. Oguz Savas and Josh Heytvelt dont pull down many offensive rebounds due to how much time they spend out on the perimeter, though Goran Suton shows well due to his excellent ability to anticipate caroms of the rim.
Defensive Rebounds Per-40 Minutes Pace Adjusted
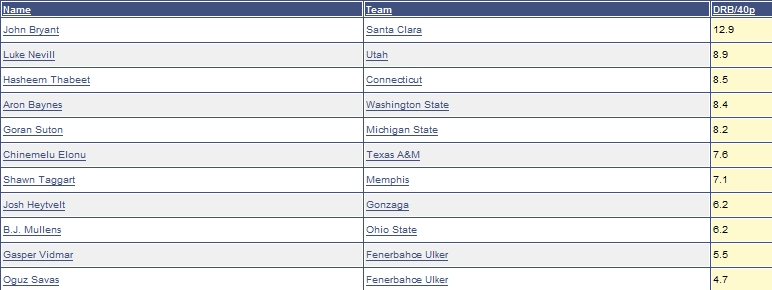
This stat tells us how well this group of bigman used their size on the defensive glass. John Bryant walks away with first place by this metric. His size in comparison to his competition was simply insurmountable on the glass. Often the tallest and easily the strongest player on the floor, Bryant pulled down boards at an incredible rate. Hasheem Thabeet comes in well behind Bryant and shortly after Luke Nevill, but one has to wonder how Thabeet would have fared had he played for Santa Clara. B.J. Mullens doesnt look like anything special here, showing that he still needs to learn how to use his size effectively. Thatll be the first obstacle hell need to overcome on the next level to become a more effective rebounder.
Steals Per-40 Minutes Pace Adjusted
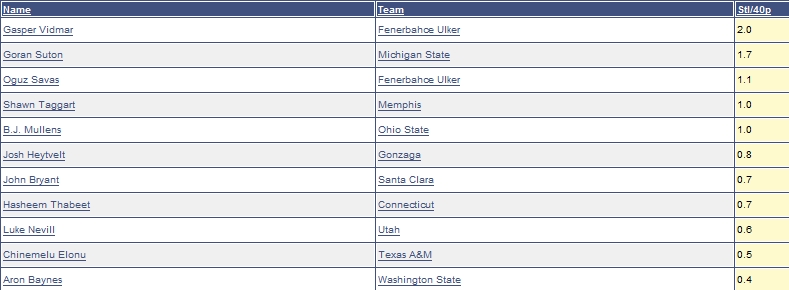
This stat tells us a bit about the quickness and defensive versatility of these prospects. Gasper Vidmar has decent athleticism for a player his height, and shows good aggressiveness defensively, allowing him to place first on our list. Goran Sutons anticipation shows through again here, and theres a significant drop off after him. Neither B.J. Mullens nor Hasheem Thabeet came up with many steals, not displaying quick hands going after loose balls in the paint, which in some ways could be a good thing, since it means their keeping their hands up and using their size to contest shots.
Blocks Per-40 Pace Adjusted
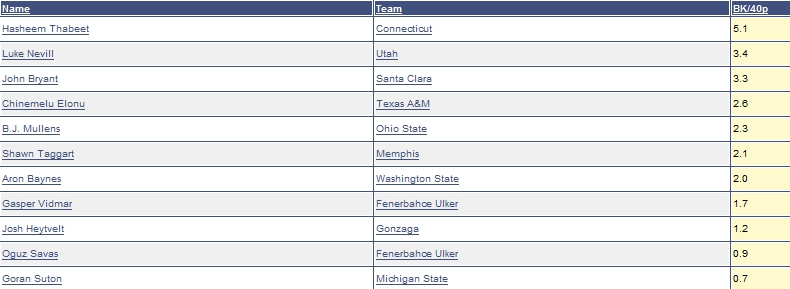
A measure of defensive presence, Hasheem Thabeet is easily the best shot blocker in this group. Possessing ridiculous length and nice athleticism, no player on this list is working with an equal caliber of tools. B.J. Mullens and Chinemelu Elonu both come close, but neither shows all that well by this metric. They simply dont have the experience of being a stopper that Thabeet does. Unsurprisingly, Josh Heytvelt, Oguz Savas, and Goran Suton are the worst shot blockers in our group. They each are carrying around a bit of extra weight and lack the raw explosiveness that their peers display.
Personal Fouls Per-40 Pace Adjusted
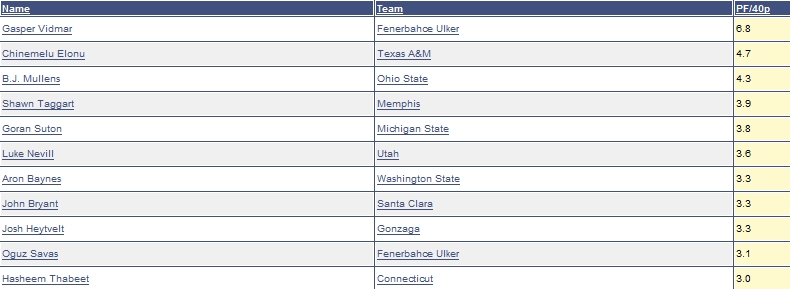
This stat tells us which of our centers is taking themselves off the floor with their fouling. In an interesting development, Hasheem Thabeet is the least foul prone player on our list. This comes as a bit of a surprise considering the role he plays. Gasper Vidmar is easily the most foul-prone player on our list, though Chinemelu Elonu and B.J. Mullens are nearly as foul-prone when you take level of competition and minutes into account.
Team Possesions
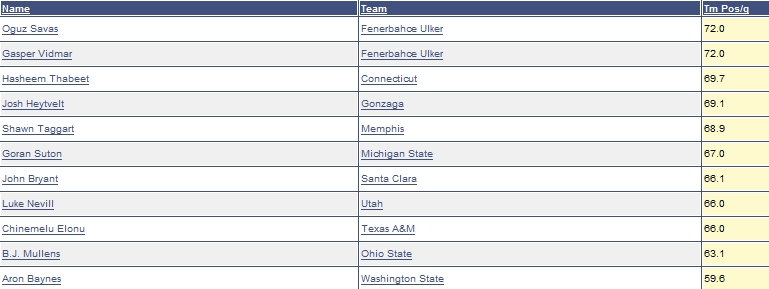
Fenerbahce heads our list since UNC doesnt have a prospect on this list. This helps put Oguz Savass statistics in perspective, since his team was moving a bit faster than any of our NCAA prospects. Gonzaga and Connecticut played at similar speeds this season, while Ohio State and Washington State slowed things down considerably. That may have worked to Aron Bayness advantage, but it is hard not to think that Mullens could have been a bit better off on a team that would have allowed him to get some easier baskets comes from their primary or secondary fast break.
Player Efficiency Rating
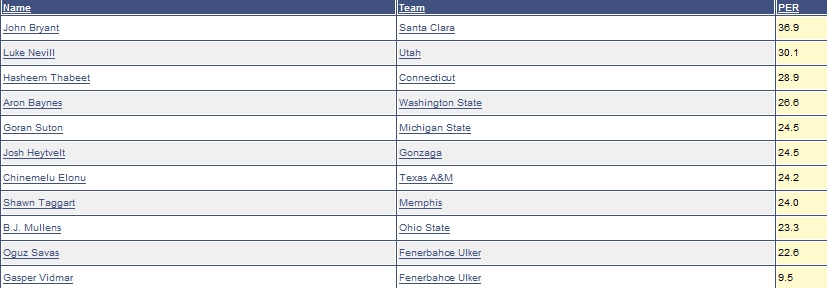
Player efficiency rating was created by John Hollinger to measure the overall impact of a player in one stat. The rating uses an average PER of 15 derived from the NBA, which leads to inflated PERs for top collegiate prospects or non-prospects as the case may be. John Bryant dominates this table, as he controlled the interior on both ends against inferior opposing centers. Like Nevill also proves capable by this standard, with Hasheem Thabeets rebounding and shot blocking earning him the third slot. B.J. Mullens takes a fall here due to his lack of bulk productivity and efficiency.
Efficiency Per-40 Minutes
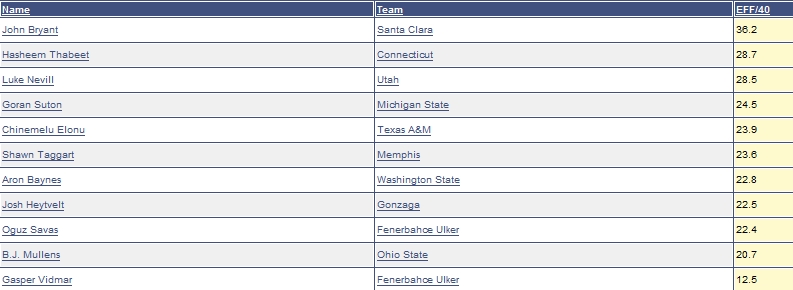
The "EFF" Statistic was created by the NBA to measure the overall statistical production of a player on the court. It adds up all the positive stats a player accumulates and subtracts all the negatives. For what it is worth, this stat makes more sense when calculated over 40 minutes rather than per game. This table looks a bit like the last, though Hasheem Thabeet overtakes Luke Nevill due to some differences in valuation of particular stats. B.J. Mullens falls even farther here, as he was just too raw to produce the stats that this metric accounts for at Ohio State.


Comments